function(input, output, session) {
  output$plot <- renderPlot({
    plot(cars, type=input$plotType)
  })

  output$summary <- renderPrint({
    summary(cars)
  })

  output$table <- DT::renderDataTable({
    DT::datatable(cars)
  })
}
library(markdown)

navbarPage("Navbar!",
  tabPanel("Plot",
    sidebarLayout(
      sidebarPanel(
        radioButtons("plotType", "Plot type",
          c("Scatter"="p", "Line"="l")
        )
      ),
      mainPanel(
        plotOutput("plot")
      )
    )
  ),
  tabPanel("Summary",
    verbatimTextOutput("summary")
  ),
  navbarMenu("More",
    tabPanel("Table",
      DT::dataTableOutput("table")
    ),
    tabPanel("About",
      fluidRow(
        column(6,
          includeMarkdown("about.md")
        ),
        column(3,
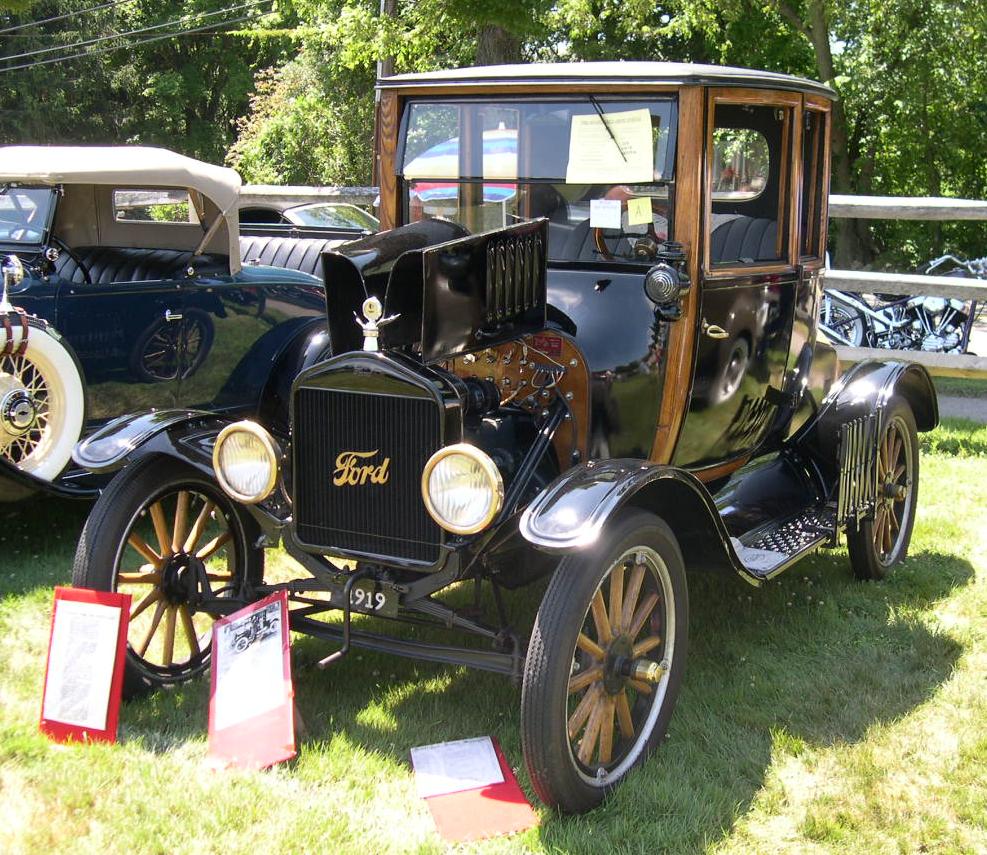
          img(class="img-polaroid",
            src=paste0("http://upload.wikimedia.org/",
            "wikipedia/commons/9/92/",
            "1919_Ford_Model_T_Highboy_Coupe.jpg")),
          tags$small(
            "Source: Photographed at the Bay State Antique ",
            "Automobile Club's July 10, 2005 show at the ",
            "Endicott Estate in Dedham, MA by ",
            a(href="http://commons.wikimedia.org/wiki/User:Sfoskett",
              "User:Sfoskett")
          )
        )
      )
    )
  )
)
 Source: Photographed at the Bay State Antique
Automobile Club's July 10, 2005 show at the
Endicott Estate in Dedham, MA by
User:Sfoskett